How dependency graphs and automated impact analysis prevent cascade failures in regulated product development.
The Change That Changed Everything
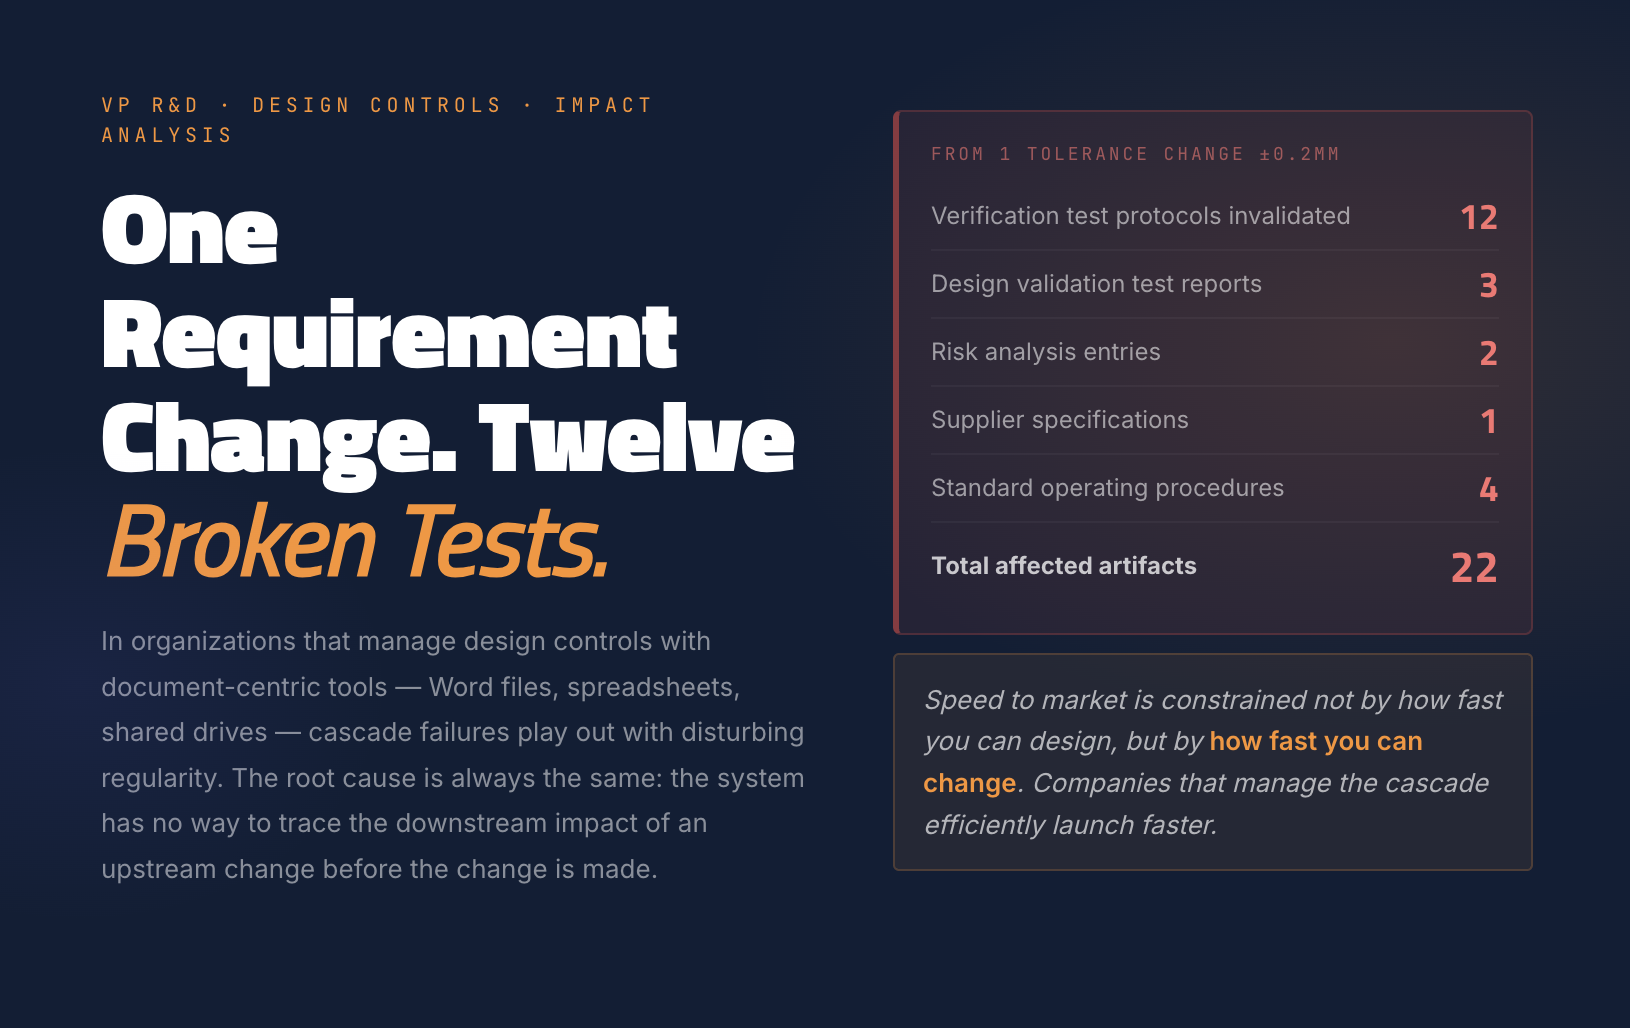
A design engineer updates a single requirement in a medical device design history file. The change is minor — a dimensional tolerance tightened by 0.2 millimeters based on manufacturing feedback. The engineer updates the requirement, revises the associated design input, and submits the change for review.
Three months later, during a pre-submission audit, the regulatory team discovers that the tolerance change invalidated 12 verification test protocols, 3 design validation test reports, 2 risk analysis entries, 1 supplier specification, and 4 standard operating procedures. None of these downstream documents were updated. The test data on file no longer demonstrates that the current design meets the current requirements.
The pre-submission timeline slips by four months. The remediation effort consumes 800 person-hours. The company misses its market window and a competitor launches first.
This is not an edge case. In organizations that manage design controls with document-centric tools — Word files, spreadsheets, and shared drives — this scenario plays out with disturbing regularity. The root cause is always the same: the system has no way to trace the downstream impact of an upstream change before the change is made.
Change. Twelve
Broken Tests.

Impact Mapping: Making a Big Impact with Software Products and Projects
As an affiliate, we earn on qualifying purchases.
As an affiliate, we earn on qualifying purchases.
The Scale of the Problem
Medical device design control under 21 CFR 820.30 and ISO 13485 Section 7.3 requires traceability between design inputs, design outputs, verification, validation, and design transfer. This traceability is not optional — it is the backbone of the design control process and the primary subject of every design history file audit.
A typical Class II medical device has 50 to 200 design input requirements. Each requirement traces to one or more design output specifications. Each specification traces to one or more verification activities — tests, analyses, or inspections. Verification results trace to validation protocols. Risk analysis entries in the risk management file trace to both requirements and mitigations.
The total number of traceability links in a moderately complex device can exceed 2,000. In a Class III device or a combination product, the number can reach 10,000 or more.
When a single node in this network changes, every connected node must be evaluated for impact. In a manual system, that evaluation depends on someone — usually the design engineer who initiated the change — knowing the full extent of the traceability network. In practice, no individual has that knowledge for a complex device. The network is too large, too interconnected, and changes too frequently for any person to hold it in their head.
The result is incomplete impact assessment. Changes are made without full understanding of their downstream consequences. Cascade failures accumulate silently until they surface during an audit, a regulatory review, or — worst case — a field failure.

katerk 6pcs Red&Black Bit Holder with Carabiner Socket for Mens Gift, 1/4 inch Hex Shank Aluminum Alloy Screwdriver Bit Holders, Quick Release Easy Change Impact Driver Drill Bit Keychain Extension
Great Compatibility: This Katerk 1/4 inch hex shank bit holder is specifically designed for 1/4" hex shank drill…
As an affiliate, we earn on qualifying purchases.
As an affiliate, we earn on qualifying purchases.
What Impact Analysis Actually Requires
Effective impact analysis in a regulated design environment requires three capabilities that most QMS tools do not provide.
A Live Dependency Graph
The first requirement is a structured, queryable dependency graph that represents every traceability link in the design control system. This is not a traceability matrix in a spreadsheet — it is a graph data structure where requirements, specifications, tests, risk items, documents, and training records are nodes, and the relationships between them are edges.
QAtrial maintains this graph as a core data structure. Every requirement is linked to its downstream specifications. Every specification is linked to its verification protocols. Every verification protocol is linked to its results. Every risk control measure is linked to both the hazard it mitigates and the verification activity that demonstrates its effectiveness. Every SOP is linked to the design transfer requirements it supports. Every training record is linked to the documents that generated the training requirement.
These links are not metadata annotations on documents. They are first-class data entities with their own attributes — link type, link status, creation date, and the identity of the person who established the link.
Automated Impact Calculation
The second requirement is the ability to calculate the full impact of a proposed change before the change is executed. When an engineer selects a requirement and indicates an intent to modify it, the system traverses the dependency graph and returns every downstream artifact that may be affected.
QAtrial’s impact analysis engine performs this traversal automatically. The output is a structured impact report that lists every affected artifact by type, owner, and current status. The report distinguishes between directly affected artifacts — those linked to the changed requirement — and indirectly affected artifacts — those linked to the directly affected items.
For the tolerance change example at the opening of this article, the impact analysis would return all 12 test protocols, all 3 validation reports, both risk analysis entries, the supplier specification, and all 4 SOPs — before the engineer makes the change. The engineer and the change review board see the full scope of impact at the point of decision, not months later during an audit.
What-If Scenario Modeling
The third requirement is the ability to model the impact of a change without actually making it. In complex design environments, there are often multiple ways to address a design issue. Each option has a different impact profile. The ability to compare impact scenarios before committing to a change path enables better decision-making.
QAtrial supports what-if analysis by allowing engineers to select any node in the dependency graph and simulate a change. The system calculates the impact cascade for each scenario, presenting the results side by side. The change review board can evaluate not just the technical merits of each option but the downstream effort required to implement it.
This changes the change control conversation from “what do we need to change?” to “which change path minimizes downstream disruption while achieving the design objective?”

Environmental Management in Practice: Vol 1: Instruments for Environmental Management
As an affiliate, we earn on qualifying purchases.
As an affiliate, we earn on qualifying purchases.
The Cost of Missing Impact Analysis
The financial impact of inadequate impact analysis manifests in several ways.
Audit remediation is the most visible cost. When an auditor discovers that downstream documents were not updated after a design change, the finding triggers a CAPA that requires retroactive impact assessment, document revision, re-verification, and in some cases re-validation. For a single missed cascade, the remediation effort ranges from 200 to 1,000 person-hours. At $100 per hour for engineering staff, that is $20,000 to $100,000 per incident.
Submission delays are the most expensive consequence. Regulatory submissions — 510(k)s, PMAs, CE marking technical files — require complete and consistent design history files. A submission that contains traceability gaps will receive a deficiency letter, adding 3 to 12 months to the approval timeline. For a product with $20 million in projected first-year revenue, a 6-month delay costs $10 million in deferred revenue.
Product quality risks are the most serious concern. When a design change is not propagated through the verification and validation chain, the company loses assurance that the product meets its design requirements. This is not a documentation problem — it is a design assurance problem that can result in products that do not perform as intended.
automated impact analysis for medical devices
As an affiliate, we earn on qualifying purchases.
As an affiliate, we earn on qualifying purchases.
Integration with Change Control
Impact analysis is most effective when it is integrated with the formal change control process. In QAtrial, a design change request automatically triggers an impact analysis. The impact report becomes part of the change request record, reviewed and approved as part of the change control workflow.
The change request cannot be approved until every affected artifact has been dispositioned — either confirmed as unaffected, assigned for revision, or flagged for re-verification. This ensures that no change passes through the control process without a complete accounting of its downstream consequences.
Post-change verification is tracked automatically. When the change is approved, QAtrial creates follow-up tasks for every artifact that requires updating. Each task is assigned, tracked, and verified. The change request is not closed until all downstream updates are complete.
This creates a closed-loop change control process where every change is fully propagated through the design control system. Audit findings related to incomplete change propagation become virtually impossible because the system prevents the gap from occurring.
The Dependency Graph as a Strategic Asset
Beyond change control, the dependency graph provides strategic visibility into the design’s structure. VP R&D leaders can use the graph to identify architectural risks — requirements with an unusually high number of downstream dependencies, which represent single points of failure in the design control system. They can identify test coverage gaps — requirements with no verification links, or verification activities that test multiple requirements and may mask individual failures.
The graph also supports resource planning. When a major design change is contemplated — a platform revision, a next-generation architecture, or a product line extension — the impact analysis shows the full scope of the effort before the first engineering hour is spent. This enables accurate project planning and resource allocation, not the surprise discoveries that derail timelines and budgets.
A Practical Example
A Class II diagnostic device manufacturer maintains 120 design requirements traced to 85 design output specifications, 95 verification protocols, 40 risk control measures, and 30 SOPs. Total traceability links: approximately 1,800.
The R&D team proposes a change to the device’s sample handling mechanism to improve reliability. Three design approaches are under consideration, each affecting a different subset of requirements.
Using QAtrial’s what-if analysis, the team evaluates the impact of each approach. Option A affects 8 requirements with 34 downstream artifacts. Option B affects 3 requirements with 12 downstream artifacts. Option C affects 5 requirements with 22 downstream artifacts.
Option B achieves the reliability improvement with one-third the downstream impact of Option A. The team selects Option B, saves approximately 400 engineering hours in downstream updates, and maintains the submission timeline.
Without impact analysis, the team would likely have selected the option with the best technical characteristics — Option A — and discovered the full impact of that choice months later during the design review.
The VP R&D’s Competitive Advantage
Speed to market in regulated industries is constrained not by how fast you can design, but by how fast you can change. Every design iteration triggers a cascade of downstream activities. The companies that manage that cascade efficiently launch faster. The companies that discover cascade failures during audits launch late.
QAtrial’s impact analysis engine gives your R&D team the visibility to make change decisions with full knowledge of their consequences. It is the difference between navigating with a map and navigating in the dark.
The dependency graph is available as part of QAtrial’s open-source platform — 25+ database models, 80+ API endpoints, zero license fees. Deploy it on your infrastructure, link your design artifacts, and start making informed change decisions.
Build your dependency graph with QAtrial at github.com/MeyerThorsten/QAtrial. See the cascade before it falls.