Why medical device CEOs need real-time complaint analytics — and what happens when they don’t have them.
The Recall Crisis in Numbers
The FDA issued more than 9,000 medical device recalls in 2023 — a 115 percent increase over the prior decade. The financial impact is staggering: the industry absorbs an estimated $5 billion per year in direct recall costs. A single Class I recall can cost a mid-market device company between $10 million and $100 million when you account for remediation, regulatory response, lost revenue, litigation exposure, and brand damage.
These are not abstractions. They are line items that destroy shareholder value, end careers, and — in the worst cases — harm patients.
Here is the uncomfortable truth: the vast majority of recalls are not surprises. The signals were in the complaint data months before the recall was triggered. The failure was not in the product. It was in the system that was supposed to detect the trend.

Business Analytics: Applications To Consumer Marketing
As an affiliate, we earn on qualifying purchases.
As an affiliate, we earn on qualifying purchases.
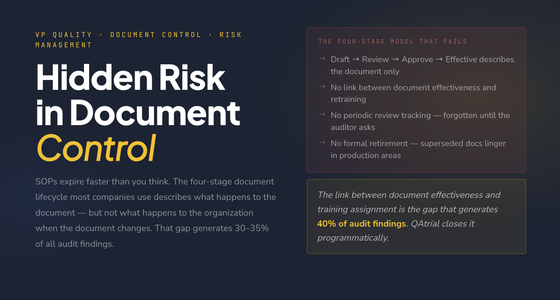
Why Complaint Data Is Your Most Valuable Asset
Medical device companies generate complaint data every day. Customer service teams log it. Regulatory affairs reviews it. Quality engineers investigate it. But in most organizations, these activities happen in silos, with different tools, different timelines, and different levels of rigor.
Trending Saves
Device Companies
Millions
+115% over prior decade
The result is a paradox: companies drown in complaint data while starving for complaint intelligence.
A single complaint is an event. Ten complaints with a shared failure mode are a signal. A rising complaint rate correlated with a specific lot, supplier, or manufacturing date is a trend that demands action. The difference between an event and a trend is the difference between a routine investigation and a field safety corrective action.
Yet most QMS platforms treat complaints as individual records to be opened, investigated, and closed. They offer basic reporting — complaint counts by product, by month, by complaint code. What they do not offer is the statistical trending that transforms complaint management from a reactive burden into a predictive capability.
real-time complaint trending tool for medical devices
As an affiliate, we earn on qualifying purchases.
As an affiliate, we earn on qualifying purchases.
The Complaint-to-Recall Timeline
Understanding the anatomy of a recall reveals where trending intervenes. The typical progression follows a predictable pattern.
In months one through three, early complaints arrive. They are individually plausible — user error, shipping damage, isolated manufacturing variance. Each is investigated and closed. No trend is detected because no one is looking for one.
In months four through eight, complaint volume increases. A quality engineer notices a pattern during a quarterly review. A CAPA is opened, but the investigation takes weeks. Root cause analysis points to a supplier material change that was approved through the change control process six months earlier.
In months nine through twelve, the CAPA investigation confirms a systemic issue. By now, 50,000 units are in the field. The regulatory team begins a health hazard evaluation. Legal is briefed. The recall decision is made.
Total elapsed time from first signal to recall action: nine to twelve months. Total cost: $10 million to $100 million.
Now consider the same scenario with real-time complaint trending.
In month one, the system ingests complaints and applies statistical process control methods. Individual complaints are below the control limit. No action required.
In month two, the complaint rate for the affected product-lot combination exceeds the upper control limit. The system flags the trend automatically and generates an alert.
In month three, a quality engineer reviews the trending data, confirms the pattern, and opens a CAPA linked directly to the flagged complaints. The investigation identifies the supplier material change within days because the system’s impact analysis traces the change to the affected product lines.
In month four, a field action is initiated for 8,000 units — not 50,000. The corrective action is targeted, fast, and an order of magnitude less expensive.
Total elapsed time: four months. Total cost: $500,000 to $2 million. The trending system just saved $8 million to $98 million.

Preventing Medical Device Recalls
As an affiliate, we earn on qualifying purchases.
As an affiliate, we earn on qualifying purchases.
What Real Complaint Trending Requires
Effective complaint trending is not a dashboard with bar charts. It requires several interconnected capabilities working in concert.
First, it requires automated intake and classification. Every complaint must be captured in a structured format with consistent coding. Free-text complaints are useless for trending until they are classified. QAtrial’s complaint management module enforces structured intake with standardized complaint codes, product identifiers, lot numbers, and failure mode classifications.
Second, it requires statistical process control. Trending means comparing observed rates against expected baselines using validated statistical methods — not eyeballing a line chart. Control limits, run rules, and regression analysis separate real signals from noise. QAtrial applies these methods automatically across every product-complaint combination in your portfolio.
Third, it requires complaint-to-CAPA linkage. Detecting a trend is worthless if the response is slow. The trending alert must flow directly into a CAPA workflow with full traceability — which complaints triggered the CAPA, what root cause was identified, what corrective actions were taken, and what effectiveness checks were performed. QAtrial links complaints to CAPAs programmatically, not through manual cross-referencing.
Fourth, it requires design feedback loops. The most valuable outcome of complaint trending is not the CAPA — it is the design change. When complaint data flows back into design controls, you do not just fix the current problem. You prevent the next generation of the product from inheriting it. QAtrial’s impact analysis engine maps complaint trends to design inputs, risk analysis documents, and verification and validation protocols.

HEARTSINE DATA MANAGEMENT SOFTWARE
Part Number: PAD-ACC-02
As an affiliate, we earn on qualifying purchases.
As an affiliate, we earn on qualifying purchases.
The Regulatory Imperative
FDA’s expectation is explicit. 21 CFR 820.198 requires manufacturers to analyze complaint data for trends. The 2023 QMSR final rule further aligns FDA expectations with ISO 13485:2016, which requires “analysis of data” including complaint trending in Section 8.4.
EU MDR Article 83 mandates post-market surveillance systems that include “systematic procedures to proactively collect and review experience gained from devices placed on the market.” MDCG 2020-7 guidance specifically requires trend analysis of complaints and incidents.
These are not suggestions. They are requirements. And during an audit, “we review complaints quarterly in a spreadsheet” is not a defensible answer.
QAtrial provides the automated trending, alert generation, and traceability documentation that auditors expect — without the $25,000 to $100,000 annual license fee that commercial vendors charge for the same capability.
The Business Case Beyond Compliance
Compliance is the floor. The business case for complaint trending extends well beyond passing audits.
Revenue protection is the primary driver. Every recall delays product shipments, triggers customer defections, and damages brand equity. A medical device company with $100 million in annual revenue can lose 5 to 15 percent of that revenue in the year following a major recall. Effective trending reduces recall probability and limits recall scope when action is necessary.
Insurance and litigation costs decrease measurably. Product liability insurers look favorably on companies with demonstrable post-market surveillance capabilities. Complaint trending documentation is a powerful exhibit in product liability defense — it shows the company was actively monitoring and responding to field performance data.
Operational efficiency improves when complaint management shifts from reactive investigation to proactive detection. Quality engineers spend less time on individual complaint investigations and more time on systemic improvements. The complaint-to-CAPA cycle time compresses from months to weeks.
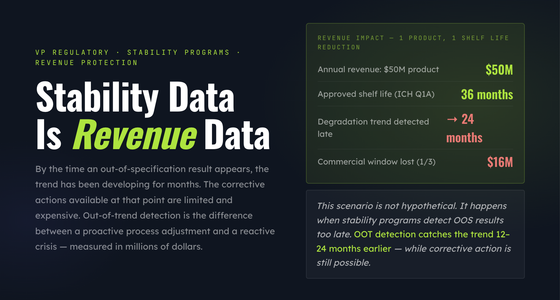
A Real-World Scenario
Consider a mid-market orthopedic device company with 15 product families and $80 million in annual revenue. The company receives 200 to 400 complaints per month across its portfolio. Under the traditional model, a quarterly complaint review identifies a trend in month nine. A Class II recall of 40,000 units costs $12 million in direct expenses and $6 million in lost revenue.
Under a trending-enabled model with QAtrial, the same signal is detected in month three. A targeted field correction addresses 6,000 units at a cost of $1.2 million. Revenue impact is negligible because the response is fast and the scope is narrow.
The net savings: $16.8 million on a single event. The five-year infrastructure cost of running QAtrial: $15,000 to $30,000.
The return on investment is not a percentage. It is a multiple — a large one.
What CEOs Should Demand
If you lead a medical device company and you cannot answer the following questions in real time, your complaint management system is failing you. What is the complaint rate trend for each product family over the last 12 months? Which product-lot combinations have exceeded statistical control limits in the last 90 days? How many days elapse between trend detection and CAPA initiation? What percentage of design changes in the last two years were driven by complaint data?
These are not quality department questions. They are enterprise risk questions. They belong on the CEO’s dashboard.
The Path Forward
QAtrial’s complaint management and trending module is available today at no license cost. It is open source under the AGPL-3.0 license, deployable on your infrastructure, and designed for the regulatory requirements of medical device companies operating under FDA 21 CFR Part 820, ISO 13485, and EU MDR.
The complaint data is already flowing into your organization. The question is whether you are extracting the intelligence it contains — or waiting for the recall to tell you what it already knew.
Explore QAtrial’s complaint trending capabilities at github.com/MeyerThorsten/QAtrial. The signals are in your data. Start reading them.