
Why out-of-trend detection in stability programs is a revenue protection strategy, not just a regulatory compliance exercise.
The Revenue You Do Not See Eroding
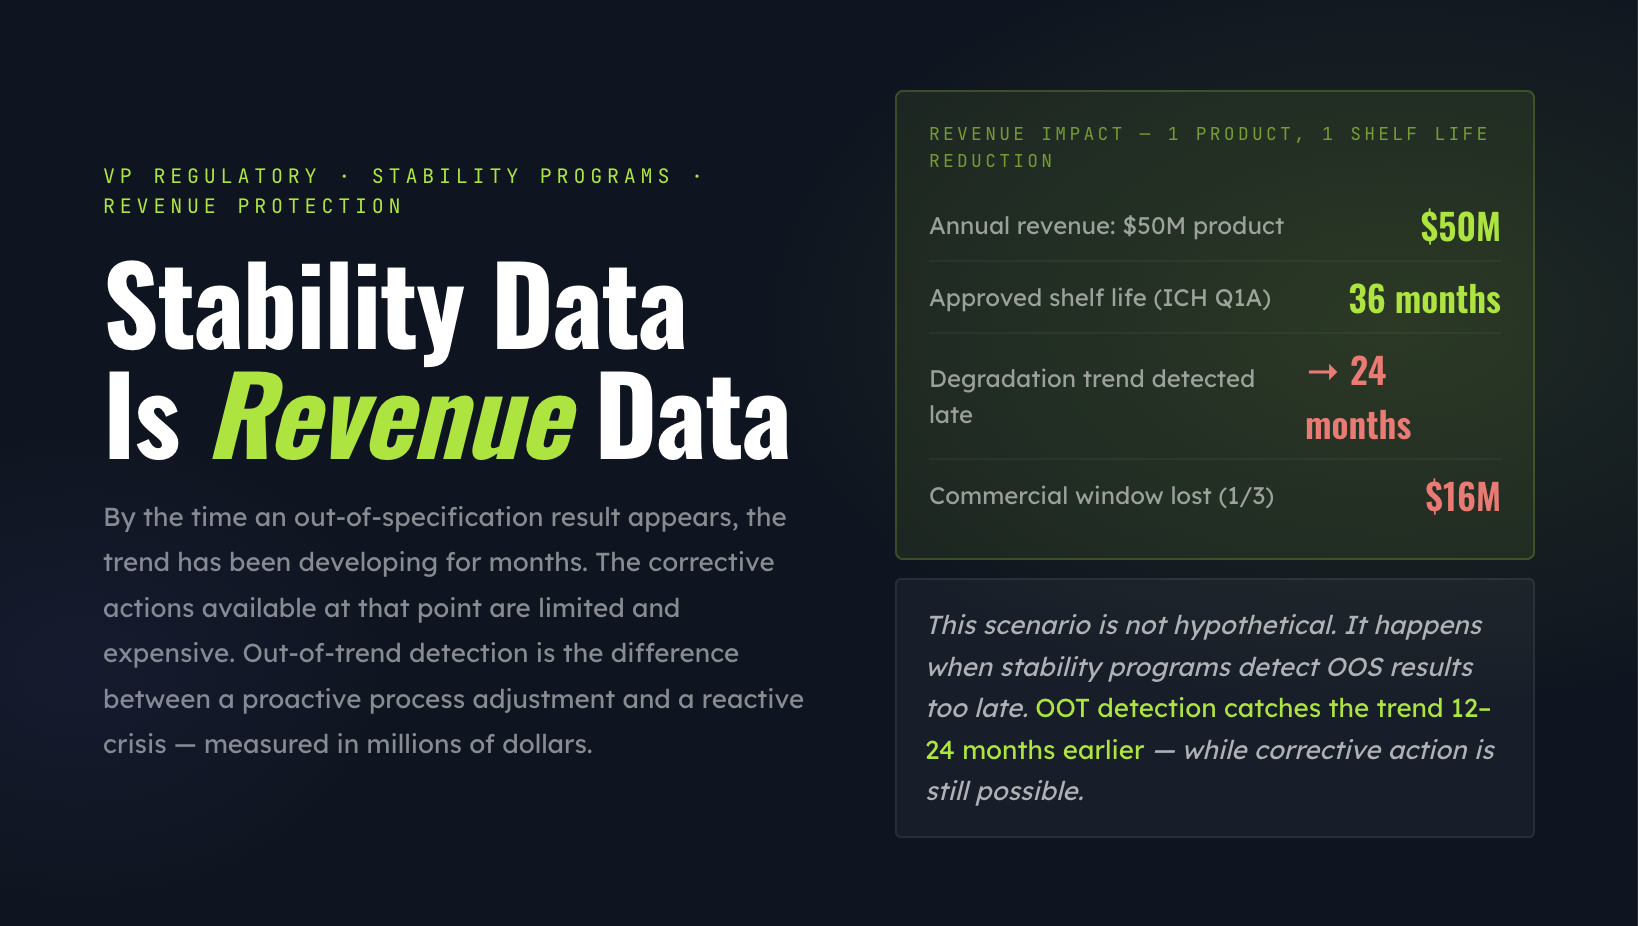
Every pharmaceutical product has a shelf life. That shelf life is not a guess — it is a regulatory commitment backed by stability data generated under ICH Q1A guidelines. The shelf life printed on the label determines how long the product can be stored, distributed, and sold. It directly controls the commercial window for every unit produced.
When stability data trends toward failure, shelf life is at risk. A product approved with a 36-month shelf life that shows degradation trending at 24 months faces a devastating commercial consequence: one-third of its saleable life disappears. For a product generating $50 million in annual revenue, that shelf-life reduction translates to $16 million in lost revenue from shortened distribution windows, increased returns, and accelerated obsolescence.
Is Revenue Data
to act before impact
This scenario is not hypothetical. It happens when stability monitoring programs detect out-of-specification results — OOS — too late. By the time a result falls outside the specification limit, the trend has been developing for months. The corrective actions available at that point are limited and expensive: field alerts, revised labeling, shortened dating, or withdrawal.
The alternative is detecting the trend before it reaches the specification limit. That is what out-of-trend — OOT — detection does. And it is the difference between a proactive process adjustment and a reactive crisis.

LINXINO BT880 Car Battery Tester,12V/24V Battery Load Tester with Built-in Thermal Printer, 20-2000 CCA Testing,Cranking/Charging Test,Voltage/Current Monitor,Data Logging & Safety Protections
【Wide Compatibility】BT880 car battery tester supports testing for 12V & 24V lead-acid batteries, including regular flooded, AGM flat…
As an affiliate, we earn on qualifying purchases.
As an affiliate, we earn on qualifying purchases.
OOT vs. OOS: The Critical Distinction
Out-of-specification results are clear: the measured value exceeds the acceptance criterion. An OOS result triggers a mandatory investigation under FDA and EMA guidance. It is a compliance event with defined regulatory consequences.
Out-of-trend results are subtler and, paradoxically, more valuable. An OOT result is a data point that, while still within specification, deviates from the expected trend or shows an unexpected rate of change. It is a statistical signal, not a specification failure.
Consider a tablet product with an assay specification of 90.0 to 110.0 percent of label claim. Historical stability data shows the assay declining at a rate of 0.5 percent per year, with the 36-month result typically falling at 96 to 97 percent. If the 12-month time point comes back at 95.5 percent — within specification but below the expected trend line — that is an OOT signal. The degradation rate has accelerated. If the acceleration continues, the 36-month result may fall below 90.0 percent.
Detecting that acceleration at 12 months gives you 24 months to investigate, identify the root cause, and implement corrective action. Waiting for the 36-month OOS result gives you zero months. The product is already on the market with an expiry date it may not support.
out-of-trend detection tools for stability programs
As an affiliate, we earn on qualifying purchases.
As an affiliate, we earn on qualifying purchases.
ICH Q1A and the Regulatory Framework
ICH Q1A(R2) defines the stability testing requirements for new drug substances and drug products. It specifies storage conditions, testing intervals, and data evaluation methods. But it does not prescribe how companies should perform trend analysis. That is left to the manufacturer’s quality system.
FDA’s guidance on OOS results (2006, updated interpretations through 2023) establishes the investigation requirements when a result exceeds specification. The guidance strongly implies — but does not mandate — that companies should have systems to detect trends before OOS results occur.
EMA’s guideline on stability testing (CPMP/ICH/2736/99) similarly requires that stability data be evaluated for trends. The expectation is that manufacturers will use appropriate statistical methods to assess whether the product will remain within specification through its labeled shelf life.
In practice, regulatory inspectors increasingly expect to see OOT procedures and evidence of their application. A company that presents stability data with a clear degradation trend and no evidence of OOT detection will face questions about the adequacy of its stability monitoring program.
QAtrial’s stability module implements both OOS flagging and OOT detection with configurable statistical methods, giving companies the analytical infrastructure that regulators expect.
pharmaceutical stability data management system
As an affiliate, we earn on qualifying purchases.
As an affiliate, we earn on qualifying purchases.
The Statistical Methods That Matter
Effective OOT detection requires more than comparing each new result to a static limit. It requires statistical methods that account for expected trends, historical variability, and the predictive implications of each new data point.
Regression analysis is the foundation. For each stability-indicating parameter, the system fits a regression model to the historical data and projects the trend to the end of the proposed shelf life. QAtrial calculates the regression slope, the 95 percent confidence interval, and the predicted value at each future time point. If the projected trend line crosses the specification limit before the labeled shelf life, the system flags an OOT condition.
Control chart methods complement regression analysis by detecting unexpected variability. A result that falls within the regression confidence interval but outside the historical control limits may indicate a change in the degradation mechanism — a signal that warrants investigation even if the overall trend projection is acceptable.
Rate-of-change analysis detects acceleration. If the degradation rate between time points T2 and T3 significantly exceeds the rate between T1 and T2, the system flags the acceleration. This is particularly valuable for products with complex degradation kinetics where a single regression model may not capture non-linear behavior.
QAtrial applies these methods automatically to every stability study in the system. The stability scientist reviews flagged conditions and decides whether to initiate an investigation — but the detection is algorithmic, not dependent on manual data review.

Seachem MultiTest Iron Test Kit
Measures iron to less than 0.05 mg/L
As an affiliate, we earn on qualifying purchases.
As an affiliate, we earn on qualifying purchases.
Shelf Life as a Revenue Variable
The commercial implications of stability data are underappreciated by quality teams and underanalyzed by finance teams. Shelf life directly determines several revenue-critical parameters.
Distribution window defines how far from the manufacturing site a product can be shipped. A product with a 36-month shelf life can be distributed globally, including to markets with 12 to 18 months of minimum remaining shelf life requirements at point of receipt. A product with a 24-month shelf life may be limited to domestic or regional distribution.
Inventory carrying cost increases as shelf life decreases. Shorter-dated products require faster inventory turns, which means smaller batch sizes, more frequent manufacturing campaigns, and higher per-unit production costs.
Return and destruction rates correlate directly with shelf life. Products with shorter shelf life generate more expired returns from the distribution chain. Each expired unit represents a complete loss of manufacturing cost plus reverse logistics expense.
For a product portfolio generating $200 million in annual revenue, a systematic improvement in stability monitoring — catching OOT conditions six months earlier and implementing corrective actions that preserve shelf life — can protect $5 million to $15 million in annual revenue that would otherwise be lost to shortened dating, increased returns, and restricted distribution.
A Practical Scenario
A generic pharmaceutical company manufactures an oral solid dosage product with a 24-month shelf life approved based on ICH accelerated and long-term stability data. Annual revenue for the product is $30 million.
At the 6-month long-term stability time point for a recently manufactured batch, the dissolution result comes back at 82 percent — within the specification of NLT 80 percent but significantly lower than the historical average of 88 percent at six months. In a manual review process, the analyst notes the result is within specification and files it.
Twelve months later, the 18-month time point returns at 76 percent — below the 80 percent specification limit. An OOS investigation is triggered. Root cause analysis identifies a raw material supplier change that affected the tablet’s dissolution profile. By this time, 24 months of production using the affected raw material are in the field.
The company initiates a field alert, revises the product’s shelf life to 12 months pending further data, and negotiates with the supplier. Revenue impact: $8 million in lost sales from the shortened shelf life plus $2 million in returned product. Total: $10 million.
Now replay the scenario with QAtrial’s OOT detection. At the 6-month time point, the system’s regression analysis flags the dissolution result as statistically inconsistent with the historical trend. The projected 18-month value falls below the specification limit. An OOT alert is generated.
The stability scientist investigates immediately, identifies the raw material change as a potential root cause within weeks, and works with the supplier to revert to the original material source. Only two months of production are affected. The product’s shelf life is maintained. Revenue impact: less than $500,000 in investigation and remediation costs.
The OOT system protected $9.5 million in revenue on a single product from a single stability event.
Building a Stability Intelligence Program
QAtrial’s stability module provides the infrastructure for a comprehensive stability intelligence program. Every stability study is tracked with its protocol, storage conditions, testing schedule, and specification criteria. Results are entered against predefined testing intervals and automatically evaluated against both specification limits and trend expectations.
The system maintains a complete history of every stability batch, enabling cross-batch trend analysis that can detect systematic issues — such as a gradual change in raw material quality — that single-batch analysis would miss.
Dashboards provide stability program leaders with real-time visibility into the status of every active study, every flagged OOT condition, and every pending investigation. Regulatory submission data packages can be generated directly from the system, eliminating the manual compilation that typically consumes weeks of a regulatory affairs team’s time before each submission.
The VP Regulatory’s Mandate
Stability data is the foundation of your product’s regulatory authorization. It determines shelf life, storage conditions, and labeling claims. It is reviewed at every inspection and scrutinized in every submission.
If your stability monitoring program cannot detect out-of-trend conditions before they become out-of-specification failures, you are managing stability reactively. And reactive stability management costs revenue.
QAtrial provides algorithmic OOT detection, automated trend analysis, and integrated stability study management — at no license cost. The statistical methods are validated. The regulatory framework is built in. The revenue protection starts the day you deploy it.
Protect your shelf life with QAtrial’s stability module at github.com/MeyerThorsten/QAtrial. Your stability data is telling you something. Make sure you are listening.